
Weather widget for digital signage with a video demo

Display the weather on your piSignage display with a simple weather widget. All you have to do is copy few lines of code from our github page in a text file, enter required location details and upload the edited file as an asset. Let us look at it step by step.
You can either refer to the video demo or follow the step by step explanation followed.
STEP 1
Go to the github page of piSignage to get the weather widget file. You can just google “piSignage github weather” to the link to the page will be available. open the link. (refer screenshot below)
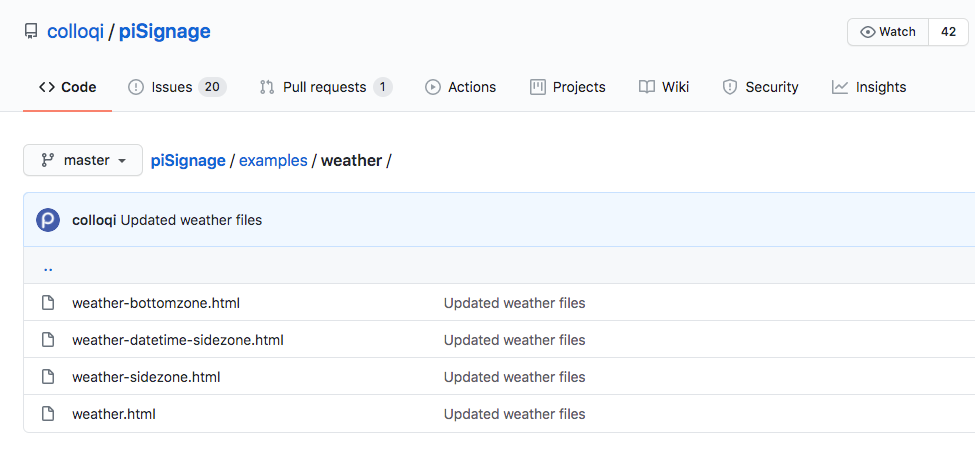
In the page there are 4 files each suitable for different zones in layout. You can display weather in a main zone,side zone or bottom zone.
If you are in the main github page of piSignage, you will find the weather files under example section. For the demo here we will use the file weather.html , which can be used in layout 1, ie a single zone layout. (default main zone). click on the weather.html link. A page with widget code opens.
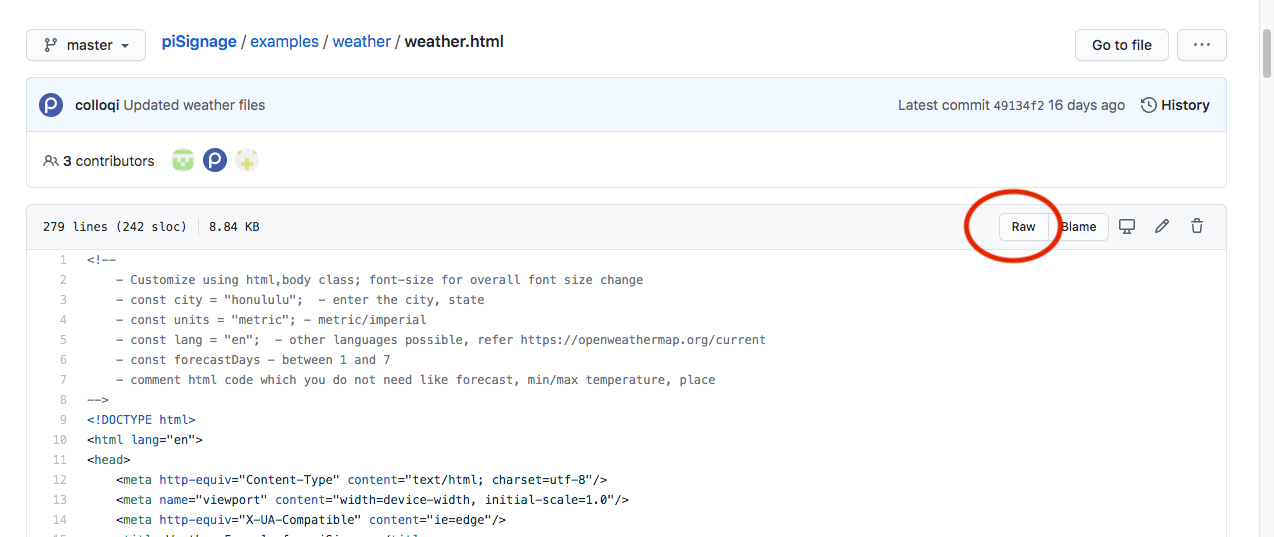
You can copy the complete code visible inside the box and paste it in a text file. Easier way is click on the Raw button on the top right of the page.
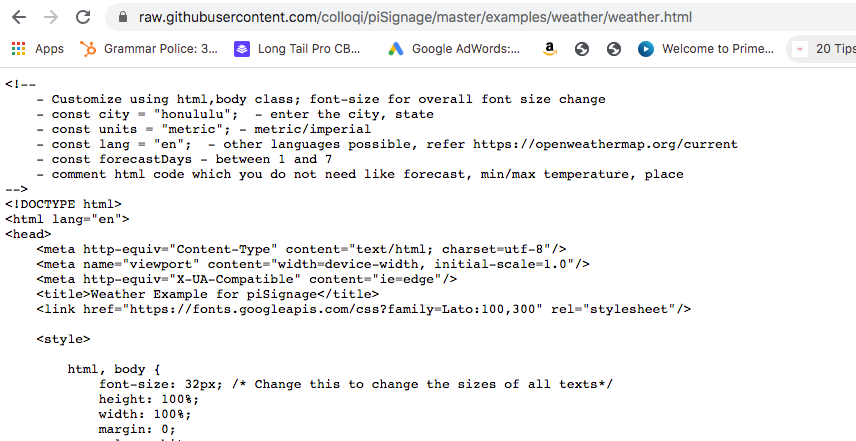
Complete text of the code will be displayed in a browser window.
STEP 2
a) Open a new text file.
b) Copy the entire code. You can use CTRL A —> CTRL C —> CTRL V sequence to select, copy and paste the code in a text file. (CMD A-->CMD C --> CMD V for Mac users)
STEP 3
Edit inputs as per your need. Around line 158 of code pasted in your editor, you will find code text
const city = "Honolulu”;
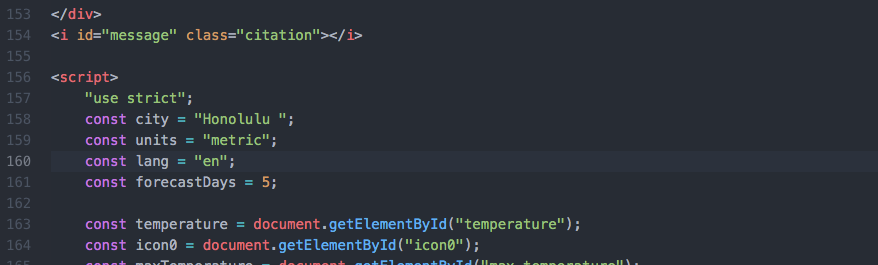
You can find this line in your file using CTRL F or a CMD F command based on your system. Now this is just default text. So if you use this code as it is temperature for Honolulu will be displayed.
Change the name Honolulu with a place of your choice. As long as the place can be found on google map, the weather of that place can be displayed. The location can be a detailed string say for example SanJose ,CA, US . This is useful to get cities with same names in different states or Countries.
You can even give the name of your establishment.
Next line is const units = "metric";
Here you can choose in what unit you need your temperature displayed , ie you can choose from standard,metric and imperial units.
For example if you want to display temperature in Fahrenheit use units=imperial , for displaying temperature in Celsius use units=metric
Default will be the standard unit. Ie in case of temperature if you don't provide any input,the temperature will be displayed in kelvin unit.
Next line is const lang = "en";
Here "en" means output will be english. You can choose a codes for set of languages provided in the link given below. For example if you want output in german, use the language code "de" . In the link below you can see the available languages and their respective code.
https://openweathermap.org/current#multi
Next line is const forecastDays = 5;
You can use the range 1 to 7. Depending on your input you will get the weather forecast for entered number of days.
Be careful to keep the code structure intact and make changes carefully so as to avoid any glitches in output due to inadvertent errors.
Once completed save the file with changes. Make sure to save the file with a .html extension. for example you can save the file as myweather.html
The file is now ready to be used as an asset in your pisignage account.
Go to assets tab and upload this file the way you would upload any other file asset. You can refer to the video about how to upload file assets.
 vyshwanara
Once you upload this file you can display this asset as part of any playlist. You can also check the weather output by opening this file in a browser.
Note that the weather file we are using is suitable to be displayed in a single zone layout. If your display is using different layout structure (multi zone layouts) choose the appropriate file in the github section.
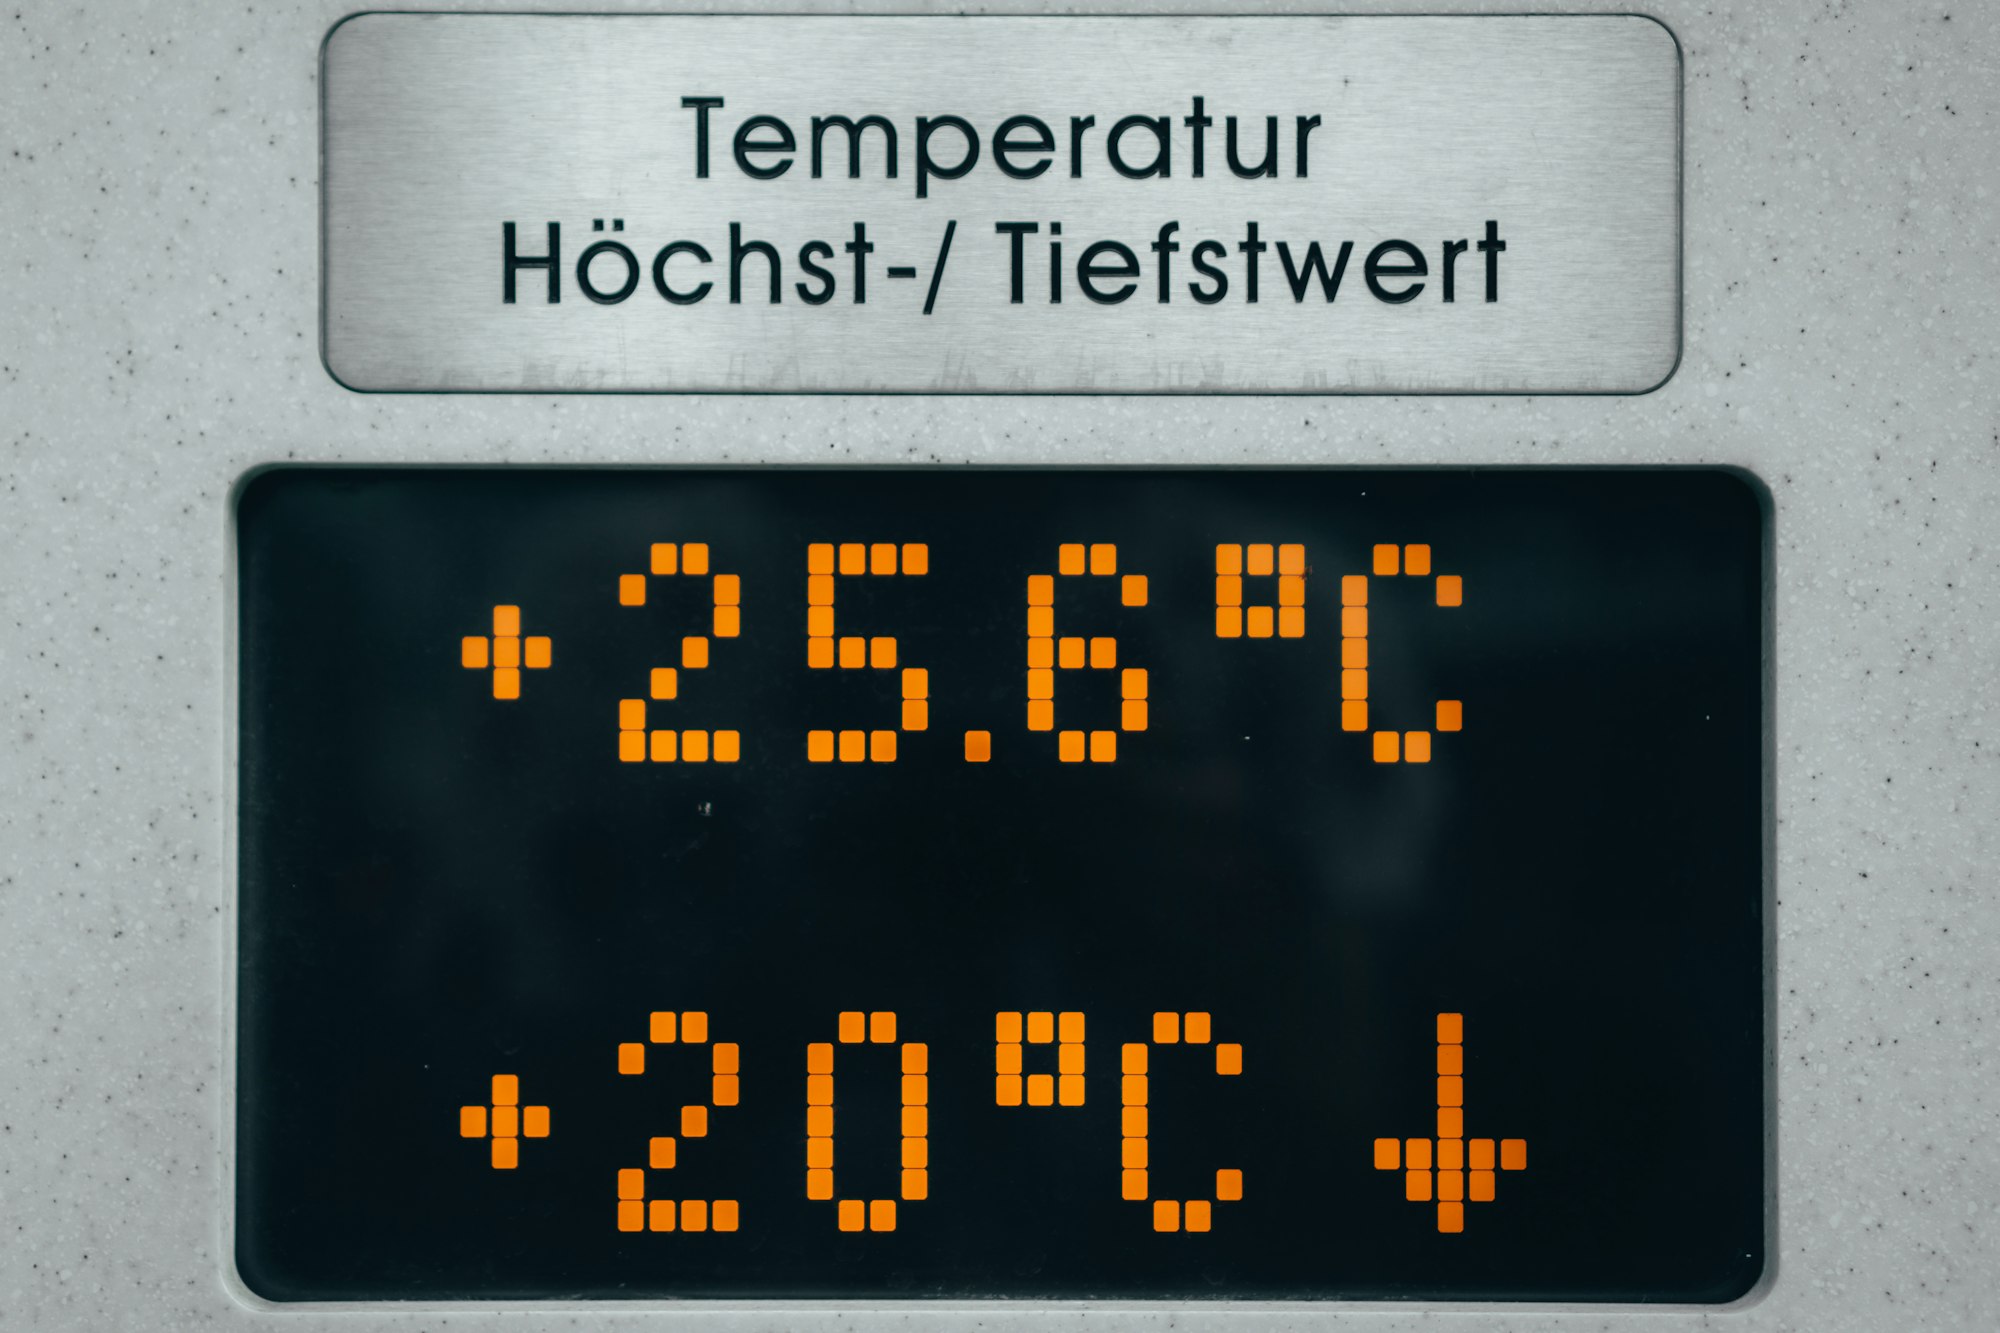
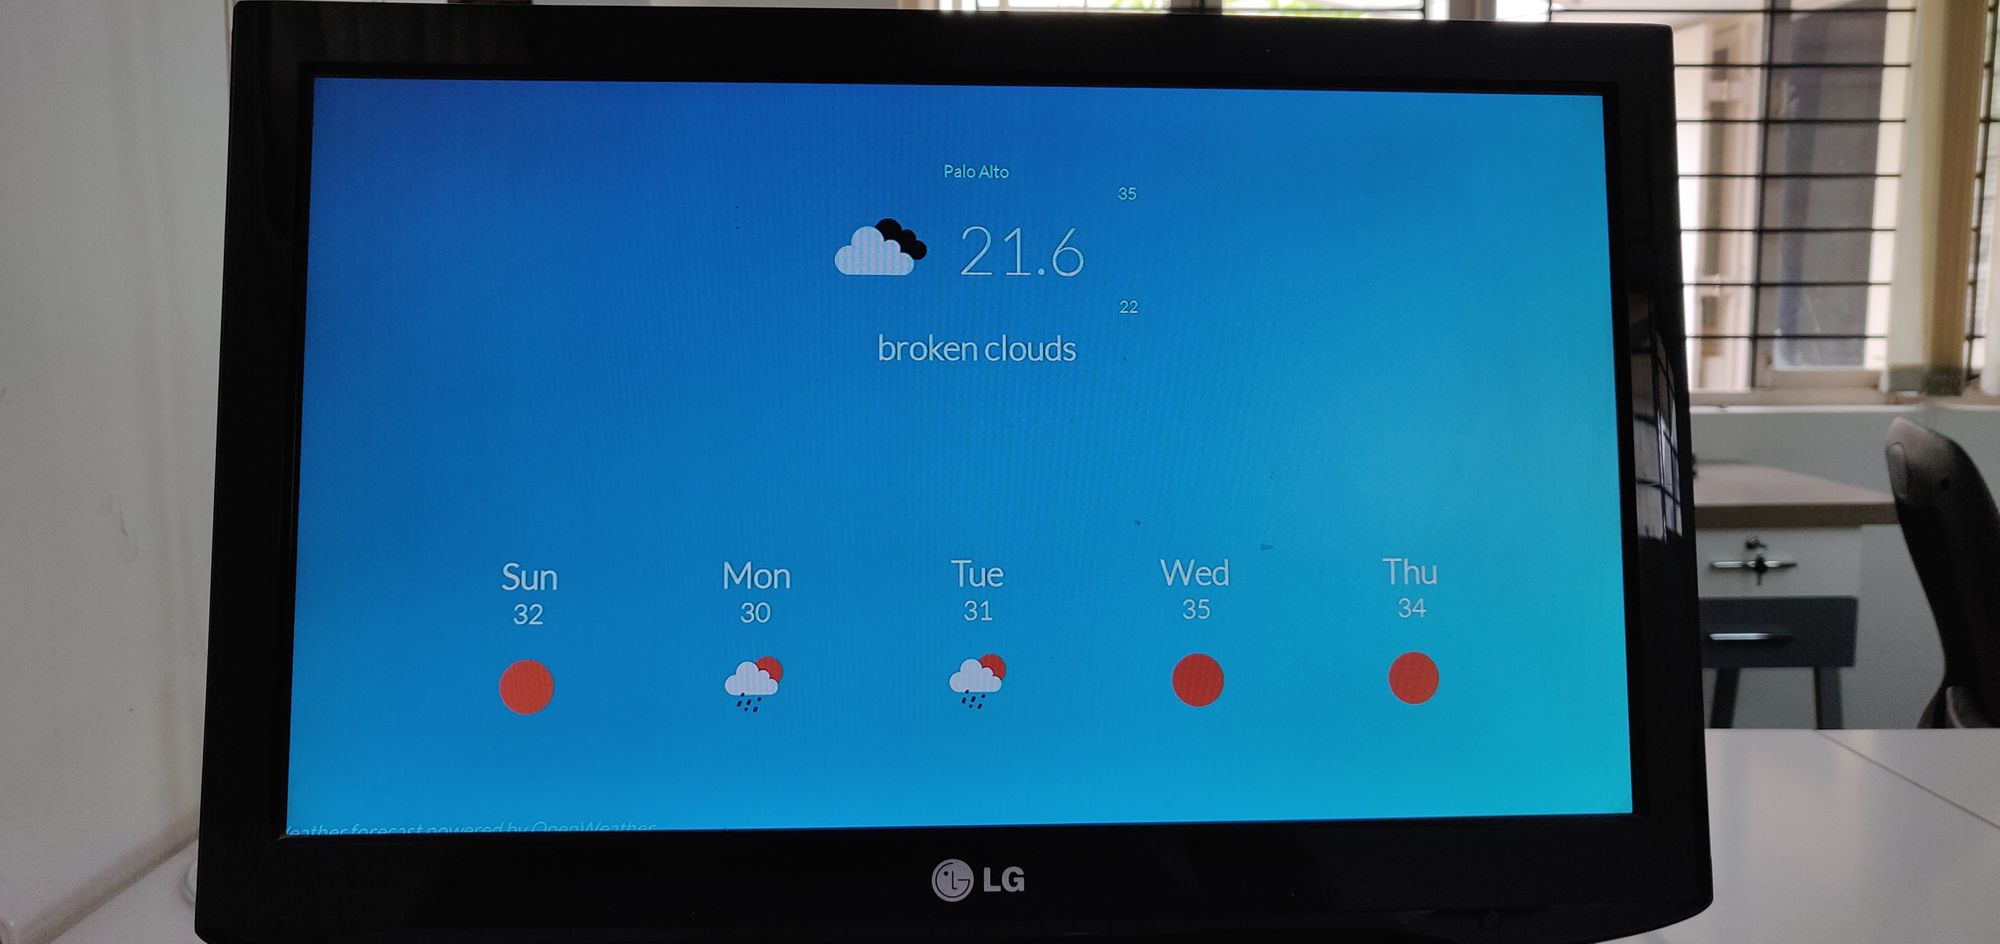
You can see the sample weather widget display for place " palo Alto " in the image below. You can see the Temperature (present,Max and min) , weather and weather forecast for the next 5 days. Apologies for the quality of camera capture . The display in real view is much more clear.
Again as said before this example is for main zone display. if you want to display weather on a side zone or a bottom zone ,in a multi zone layout, choose the appropriate file in github and edit it as per your need.
While this is a simple display, You can always modify the HTML,CSS to create your own design :)
we are also in the process of designing an app store where you can select, edit and display your widgets the way you need with simple clicks. for any help you can always write to us at info@pisignage.com